Understanding and Utilizing the Secrets of Waves
Published by Chris Riley in nauticalknowhow Last updated on April 28, 2020
Understanding and Utilizing the Secrets of Waves
Any time you picture a body of water larger than a puddle, one of the first things that comes to mind are the rolling waves, or the surf lapping at the shore. Well, at least that’s what happens with me… But waves are much more than tranquil anomalies, they can be dangerous and destructive to any vessel in almost any body of water. Understanding how waves are made, how they normally behave, and how to predict their response to weather can make the difference between a smooth, comforting time on the water and a bumpy, frightening experience.
The first rule of waves, especially in the open ocean, is that there are no rules. Kind of a hypocritical statement considering the intent behind this article, but it is a hard, cold fact. There are simple physical factors that makeup the “normal” wave, but within the forces of nature, there are a myriad of other factors that need be considered into the equation. Regardless, an understanding of what makes a “textbook” wave can be of considerable merit to the sailor. What we will examine here are the laboratory examples of wave creation. How, in a perfect world, waves would behave. In reality, alternating weather patterns, varying water depths, opposing currents, fetch obstruction, and a multitude of other factors may change the way waves in a particular area react.
Anatomy Of A Wave: How Are Waves Measured?
Keeping all of that in mind, we’ll throw out reality and concentrate on theory for a few minutes here. There are three factors that make up waves:
- Wind speed
- Length of time the wind has blown
- Distance of open water that the wind blows over; called fetch
All of these factors have to work together to create waves. The greater each of the variables in the equation, the greater the waves. Waves are measured by:
- Wave Height (from trough to crest)
- Wave Length (from crest to crest)
- Wave Steepness (angle between crest and trough)
- Wave Period (length of time between crests)
There are theoretical limitations, however, for each variable. If there is a limited fetch, say 10 nm to land, and the wind is blowing at 36 knots, the waves will be 7′ high no matter how long the wind blows. Whereas for a 36 knot wind with an unlimited fetch blowing for 56 hours can create waves of 63′.
|
Wind |
Wave |
||
|
Speed (knots) |
Fetch (nm) |
Height (feet) |
Length (feet) |
|
30 |
20 |
7.2 |
183 |
|
30 |
50 |
10.5 |
270 |
|
30 |
200 |
13.5 |
360 |
|
40 |
20 |
12 |
264 |
|
40 |
50 |
18 |
423 |
|
40 |
200 |
24 |
392 |
|
50 |
20 |
18 |
382 |
|
50 |
50 |
30 |
570 |
|
50 |
200 |
42 |
719 |
The table above demonstrates the relationship between wind speed and fetch.
Wave Height Definition
Both in theory and in reality, waves are never created in one uniform height. Waves fall into a systemic pattern of varying size. Therefore, in order to classify wave height we determine the significant wave height, which is the average of the highest 1/3 of the waves in a system. This is how weather reports will specify wave height. Once you have the significant height, it is simple to determine the theoretical average height, the highest 10% and the highest wave sizes in a given area. Mathematically speaking, it’s simple arithmetic based on predetermined ratios:
|
Average height |
.64:1 |
|
Significant height |
1:1 |
|
Highest 10% |
1.29:1 |
|
Highest |
1.87:1 |
To determine any one of the wave sizes, take the significant height and multiply it by the numerator in the applicable ratio. For example, if the significant height is 10′, the average height is 6.4′ (10 x .64), the highest 10% of the waves will be 12.9′ (10 x 1.29), and the highest waves will be 18.7′ (10 x 1.87 ).
Wave Period Definition
We can also determine the speed or period of a wave mathematically by multiplying 1.34 times the square root of the wave’s length. [This number originates from many years of scientific research on wave speed.] Hence:
- A 40′ wave travels at 8.48 knots ( 1.34 x sqrt of 40 [6.33])
- A 50′ wave travels at 9.48 knots ( 1.34 x sqrt of 50 [7.07])
- A 100′ wave travels at 13.4 knots ( 1.34 x sqrt of 100 [10])
Sea Conditions: The Types Of Waves
Waves take their time to develop; they don’t spontaneously erupt from the ocean. It takes a certain speed of wind to blow over a certain distance for a considerable length of time to create lasting waves.
There are three different types of waves that develop over time:
- Ripples
- Seas
- Swells
Ripples appear on smooth water when the wind is light, but if the wind dies, so do the ripples.
Seas are created when the wind has blown for a while at a given velocity. They tend to last much longer, even after the wind has died.
Swell waves are waves that have moved away from their area of origin and are unrelated to the local wind conditions — in other words, seas that have lasted long beyond the wind.
The definition of swells can be a bit confusing when you understand that waves never actually go anywhere . The water does not travel along with the waves, only along with the current — two mutually exclusive elements of water animation. If two people stand at either end of a long rope and undulate their arms up and down in an equal rhythm, waves will develop along the length of the rope that appear to move from one end to the other. The rope fibers aren’t actually moving at all, other than up and down. This is exactly what is happening with waves. The speed, or velocity of the wave is measured by how long it would take a wave to pass a given point crest to crest — say a line drawn on the ground beneath the rope. There is a slight movement of the water particles within a wave, but we’ll get into that in a little bit.Waves can be further described as:
- Non-Breaking
- Breaking
A non-breaking wave, is a “normal” rolling wave. A breaking wave is one who’s base can no longer support it’s top and it collapses. Depending on the size, this can happen with considerable force behind it — 5 to 10 tons per square yard. Enough force to crush the hull of a ship. When the ratio of steepness of a wave is too great, it must break. This happens when a wave runs into shallow water, or when two wave systems oppose and combine forces. The steepness ratio is expressed as the height to the length. A 1:24 is a long, shallow swell found in deep waters. A 1:14 and up is a wave that is too steep to stay together. This can also happen if the wind quickly grows strong and actually blows the top (crest) off the base of the wave. Wave characteristics also change in shallow water. Imagine if the rope that we talked about earlier was lowered to the ground so that the troughs of the waves hit the floor. This gives you some idea what happens when a wave hits shallow water, only the height and period won’t change, just the length and hence the steepness (as the length changes, so does the height to length ratio). Once the ratio gets high enough (like fractions, the closer together the numerator and denominator, the higher the fraction — 1:1 is the highest [that would be a wave at a right angle with the length exactly as long as the height.]) the wave will break.
|
Water Depth (feet) |
Wave height (feet) |
Wave length (feet) |
Period (seconds) |
|
150 + |
15 |
360 |
8 |
|
75 |
15 |
270 |
8 |
|
30 |
15 (breaks) |
210 |
8 |
|
15 |
15 (breaks) |
153 |
8 |
Ocean Conditions: Water Movement
Water particles within a wave have different patterns of movement based on whether it is a breaking wave or not. In a normal wave, there is an orbital movement of the water particles. This is best demonstrated by a cork floating in the water. As the wave rises, the cork spins in place (pushed by the orbital motion). This is a very passive movement, whereas the lined particle movement of a breaking wave is very aggressive — hence much more destructive.
|
 |
The images above demonstrate the orbital motion of a cork floating in the water as a wave passes from right to left. The cork’s position actually never changes other than a slight rotation.
Wind And Waves
The interrelationship between the wind and the waves is so important to skippers that a completely new classification system was designed as a guideline incorporating both wind speed and the wave conditions most readily found at those speeds. This system, called the Beaufort Scale , was developed in 1805 by Admiral Sir Francis Beaufort of the British Navy. It is a guideline for what can be expected in certain conditions and a weather classification system. It assumes open ocean conditions with unlimited fetch.
|
Force |
Wind Speed |
Description |
Sea Conditions |
Waves |
|
0 |
0 |
Calm |
Smooth, like a mirror. |
0 |
|
1 |
1 – 3 knots |
Light Air |
Small ripples, like fish scales. |
1/4′ – 1/2′ |
|
2 |
4 – 6 knots |
Light Breeze |
Short, small pronounced wavelettes with no crests. |
1/4′ – 1/2′ |
|
3 |
7 – 10 knots |
Gentle Breeze |
Large wavelettes with some crests. |
2′ |
|
4 |
11 – 16 knots |
Moderate Breeze |
Increasingly larger small waves, some white caps |
4′ |
|
5 |
17 – 21 knots |
Fresh Breeze |
Moderate lengthening waves, with many white caps |
6′ |
|
6 |
22 – 27 knots |
Strong Breeze |
Large waves, extensive white caps with some spray. |
10′ |
|
7 |
28 – 33 knots |
Near Gale |
Heaps of waves, with some breakers whose foam |
14′ |
|
8 |
34 – 40 knots |
Gale |
Moderately high waves of increasing length and edges of crests |
18′ |
|
9 |
41 – 47 knots |
Strong Gale |
High wind with dense foam streaks and some crests rolling over. |
23′ |
|
10 |
48 – 55 knots |
Storm |
Very high waves with long, overlapping crests. |
29′ |
|
11 |
56 – 63 knots |
Violent Storm |
Exceptionally high waves that may obscure medium size ships. |
37′ |
|
12 |
64 – 71 knots |
Hurricane |
The air is filled with foam and spray, and the sea is |
45′ |
Aside from just wind speed, the temperature is also a factor in creating waves. Warm air (which rises) moving over water has a less acute angle of attack on the surface than does cool air (which sinks). A cold front moving across open water will create much steeper waves and hence create breakers sooner than a warm front moving at the same speed.
Also, a change in wind direction over existing waves can create confusion and hence larger waves. If a wind has been blowing northeast over an open body of water for three days and suddenly switches to northwest over that same body of water, new wavelettes will form within the existing system of waves. The energy of both systems will multiply to create larger waves.
When a wave system meets a current flow one of two things can happen. If the wind and current are both going the same direction, it tends to smooth out the waves, creating long swells. If the current and wind are moving in contradicting directions, it will create much steeper and more aggressive waves.
Making Sense Of It All
So, what does all this mean? Why is it important to know how waves are made? Well… You can determine several things from waves.
One of the things you can tell based on waves is boat speed. This assumes that your vessel is a displacement ship, like a keelboat, and not a planing one like a speedboat. When sailing a displacement vessel, the boat is constantly displacing a large chunk of water as it moves along. The heavier the boat, the deeper the trough it carves through the water. Now, along with the physics of waves we discussed above, we can add that the faster a wave travels, the longer it is. As a boat’s speed increases, the number of waves that it pulls along the hull decreases until the boat is actually trapped between the crest and trough of a single wave that it has created itself moving through the water.
Boat Size Vs Wave Height
We know, from above, that the speed of a wave can be determined by the formula of 1.34 times the square root of the wave length. Since a displacement boat, traveling at top speed, is trapped in between the crest and trough of it’s own wave, we can also determine theoretical hull speed with this same formula using the boat’s L.W.L (Waterline length or length on waterline).
[It’s important to note here that L.W.L. is not the same as L.O.A. (Length overall) which is what most people use to describe a vessel. A 22′ Catalina (22′ being it’s L.O.A.) does not necessarily have a 22′ L.W.L.
A boat with a L.W.L. of 30′ has a theoretical hull speed of 7.34 knots. (1.34 x sqrt of 30 [5.48]) Now, very rarely will a boat ever reach her theoretical hull speed. This happens in the most perfect of conditions. However, since at that top speed the boat is trapped in a single wave, at lesser speeds, there will be more waves along the hull; proportionately so. If there are two waves on the windward side of the vessel then the boat is traveling at 1/2 theoretical hull speed. If there are three waves, then the boat is traveling at 1/3 that speed. You can fairly reliably judge your boat’s speed by counting the number of wave crests on the windward side between bow and stern and divide that number into your theoretical hull speed. Using this method, you can create a Dead Reckon plot without a speedometer. Though having a fully working boat speedometer is highly recommended.

Theoretical hull speed (trapped in one wave)
1/2 Hull Speed, two waves along the windward side
1/3 Hull speed, three waves along the windward side
You can also quickly spot shoals by watching the waves. A shallow area will create breakers in the middle of otherwise normal seas — this can help you further estimate your position by finding the shallow area on your chart and taking a bearing to that area.
Understanding the relationship between wind speed and fetch can also help you plan your trip and avoid uncomfortable situations. Limiting the fetch you sail in will limit the maximum size of waves that you encounter for a given wind speed, and thus further ensure that you don’t encounter a situation beyond your experience level.
|
Wind speed |
Theoretical Max Wave Height |
50 % Fetch |
75% Fetch |
100% Fetch |
|
7 – 10 knots |
2 feet |
3 nm |
13 nm |
25 nm |
|
17 – 21 knots |
8 feet |
10 nm |
30 nm |
60 nm |
|
28 – 33 knots |
20 feet |
22 nm |
75 nm |
150 nm |
|
41 – 47 knots |
40 feet |
55 nm |
150 nm |
280 nm |
|
56 – 63 knots |
63 feet |
85 nm |
200 nm |
450 nm |
By limiting the percentage of fetch (based on the theoretical max) you can considerably limit wave height that you will encounter. The theoretical max wave height above is based on an unlimited fetch and wind duration. By selecting a fetch in one of the three columns to the right of that max, you can adjust the theoretical max by that percentage. For example, in a 17-21 knot wind, with a 60 nm fetch and an unlimited wind duration, you can encounter 8 foot high waves. If you limit that fetch to 10 nm at the same wind velocity, you will encounter 4 foot high maximum waves. (50% of 8 feet).
You can determine wind direction by watching the ripples on the surface of the water (Swells may be running contradictory to current winds). Keep an eye out for shifting winds this way as the smaller waves are the greatest natural indicators at sea of wind direction. Also, using the Beaufort Scale, you can roughly determine wind speed based on the wave conditions — for instance, white caps generally form at around 12 knots of wind.
Boats In Rough Seas: Handling Rough Ocean Waves
One last area to cover before we close this opus, and that is how to handle waves encountered at sea. Whether large rolling swells, or choppy breakers, the surface activity at sea can be one of a skipper’s most challenging obstacles. The following are some guidelines on how to deal with waves.
In order to avoid big waves:
- Avoid shallow water. Not only does shallow water create breakers that move at more destructive and higher velocity than “normal” waves, but due to the sinusoidal movement of a wave, the actual nominal sea level is hard to determine. In reality, the nominal sea level is slightly below the center of trough and crest. In shallow water, you are more likely to run aground, even if the chart says you’re okay. Not to mention this can be a bumpy ride.
- Don’t go upwind in big waves. This particularly applies to sailors who when tacking upwind will be crossing large waves at a relative angle of 45º to the bow. For sailors working upwind with escalating winds, plan to make your upwind progress before the winds build and sail downwind with the large waves later.
- Use land as a natural breakwater. Sailing in the lee of an island will create smaller waves as the wind comes off land and then toward your vessel.
- If the waves are so big that you can feel them pushing your boat sideways, or backward — turn into the wave. Try to hit the crest at a perpendicular angle and head off again just as the crest reaches the bow. This minimizes the surface area that the waves can push upon. Sailors be sure to keep steerageway by heading off once you’re on the crest.
- You can estimate the height of waves by knowing your eye height above the water. If, when standing at the helm, your eye is 10′ above the surface of the water, waves just at the horizon line will also be 10′ in height.
- When sailing in big seas, the true challenge is to pay attention. In reality you can never predict what a wave system will throw at you. Waves can suddenly come up from sideways, or a large threatening wave may pass quietly while a small one might break violently into your boat. Being alert and reactive is your best bet. Don’t concentrate on one area too much, but rather the whole picture.
- Watch the weather reports. Not just for the day you are planing to sail, but the week before as well. Remember that a sudden shift in wind pattern contrary to what was happening for several days can create much larger waves in that area. You may be looking at a great fishing spot and NWS tells you that there are only 10 knot winds from the southwest there, however, what you don’t know is that the winds were blowing 10 knots from the northeast for the past five days — hence the significant wave height in that area is double what it should be for the conditions…
You can get real time wave reports over the internet from the National Weather Service.
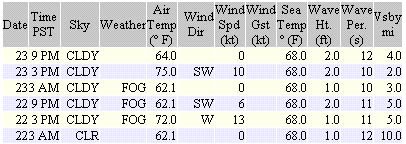
Above is an example buoy report from the internet. It clearly shows the date, time, sky conditions, weather description, temperature, wind direction, wind speed, speed of wind gusts, water temperature, significant wave height, wave period and visibility in miles.
Once you have a better understanding of wave systems, it can make your time on the water much more enjoyable. Being able to maintain a slight degree of control over what you will face while venturing out will help maintain your comfort level. Whether out for a short jaunt or a circumnavigation adventure, take care, keep a keen eye and enjoy.
Categories: nauticalknowhow


1 Comment
Stephan Clark on August 24, 2022
Really an excellent article.
Thank you.
S. Clark